
Apteco Learn Mission Schedule Time with an Apteco Architect Play with a Live System

Picking the right chart

Stop 15 of 58 · about 8 minutes

Which chart actually tells your story? Somewhere right now, a pie chart with fourteen slices is being shown to a board, and everyone is nodding and understanding nothing.
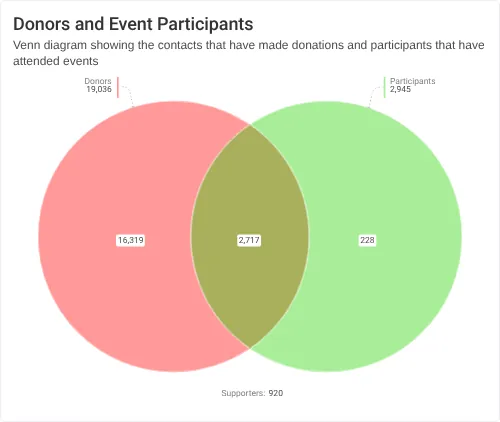
A Venn on Charity Overview: donors, event participants, and the people who are both.
A Venn on Charity Overview: donors, event participants, and the people who are both. Open the practice system

Sample charity: the people and numbers in these screens are made up, so the picture shows the tool, not a result.
The lesson

Start with your question, then pick the chart.

To show…Use a…
One big numberNumber card
A few groups side by sideColumn or bar chart
Parts of a whole, few slicesDonut or pie chart
Change over timeLine or area chart
People moving through stagesFunnel chart
Two things at once, like stage by regionCube or stacked column
Overlap, like volunteers who also giveVenn diagram
Where most of the value comes fromPareto chart
Who is over- or under-represented in a groupProfile tile

If a chart needs a long explanation, use a simpler one.

Watch this stop · about a minute

More of it in Orbit

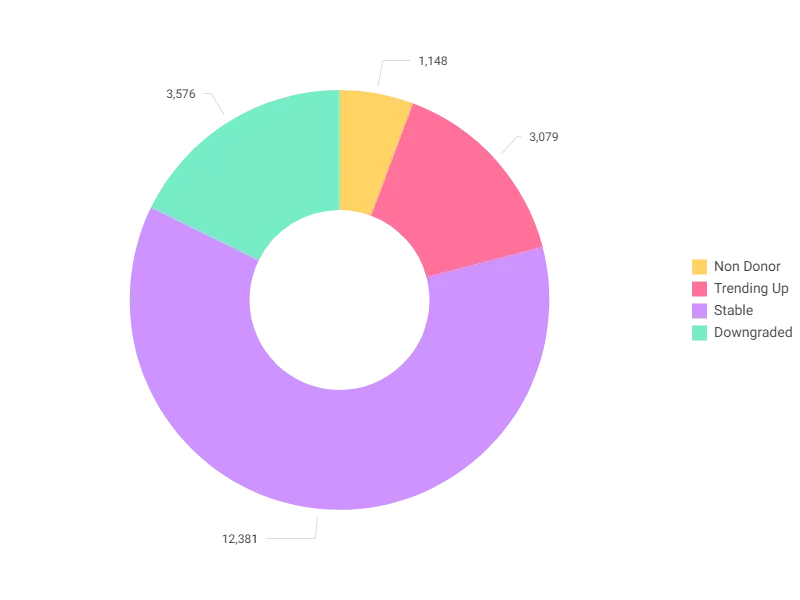
A donut on the Engagement tab: donors by giving trend, latest gift against lifetime average. Trending Up, Stable, Downgraded.
A donut on the Engagement tab: donors by giving trend, latest gift against lifetime average. Trending Up, Stable, Downgraded. Open full size

Your turn, in Orbit

  1. Open Donation Analysis.
  2. For three tiles, name the question each answers and its chart type.
  3. On a dashboard you own, click + New Tile and browse the chart types, then close without saving.

Quick check

Retention over five years. Which chart?
  • Line
  • Donut
  • Venn

Answer: Line

How many volunteers also give. Which chart?
  • Funnel
  • Venn
  • Number card

Answer: Venn

How many people move from New Donor to Loyal. Which chart?
  • Pie
  • Funnel
  • Line

Answer: Funnel

Need a hint?

Time goes on a line. Overlap goes in a Venn. Stages go in a funnel.

Why it matters

The right chart helps a whole room see what you see, in seconds.

Read on

Read more in the Apteco Help Hub

Learn Mission is a free course. You read a little, do it yourself, then answer one quick check. Orin, the assistant in Orbit, walks with you. Your progress stays in your browser.

Do this stop yourself

It is stop 15 of 58. Open it in the course, or start from the beginning.

Open this stop in the course